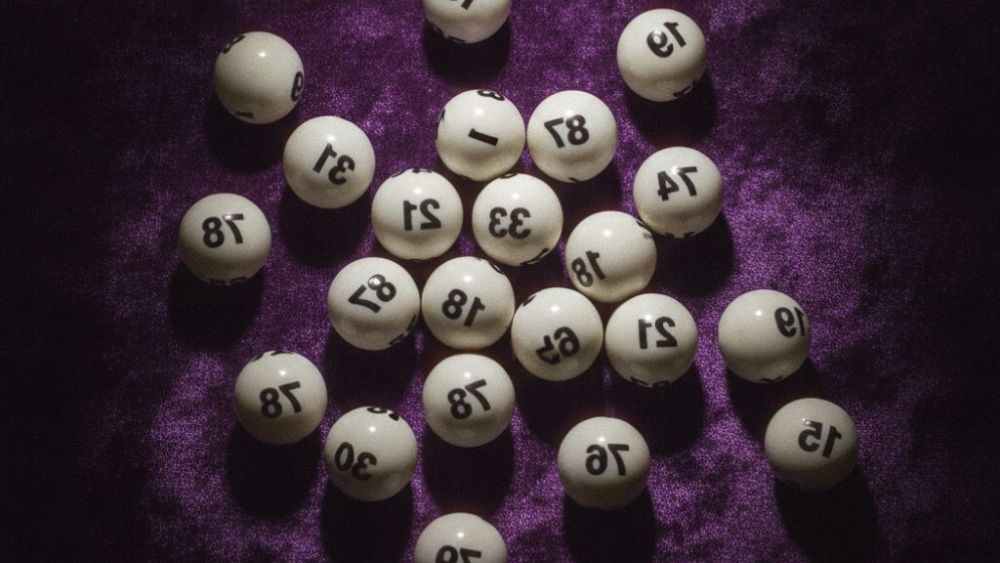
Why the Draw Board Is a Dataset, Not Just a Headline
Every night after the 9 PM draw, LottoBantay publishes the same thing every other outlet does: the winning combination, the jackpot estimate, and the number of winners. What most players do is read the first line, check their ticket, and close the page. What a statistician does is open a notebook.
Here is the mindset shift. A PCSO draw result is not an announcement. It is a data point. One data point tells you nothing. Six hundred data points tell you how a game actually behaves — how often numbers repeat back-to-back, how long a number can sit dormant, how the pot climbs between major hits, and how the machine's ball set behaves across a rotation cycle.
This guide walks you through a seven-step method for reading results the way an analyst would. It is not a system for predicting the next combination. Anyone selling you that is selling you air. It is a method for turning raw draw output into structured information you can act on with clear expectations.
One practical note before we start: PCSO operates under its congressional franchise, and all games — Lotto 6/42, Mega Lotto 6/45, Super Lotto 6/49, Grand Lotto 6/55, and Ultra Lotto 6/58 — draw under the same supervision and publish through the same channels. Whatever game you follow, the reading method is identical. Only the number pool and the odds change.
Step 1: Log the Raw Output Before You Interpret Anything
Statisticians separate collection from analysis. Do the same. For each draw, record four fields and nothing else:
- Draw date and draw code (for example, the 9 PM draw on a specific date)
- The six winning numbers, ascending
- Jackpot amount at draw time
- Number of jackpot winners and the prize each received
Do not write commentary in this log. No "lucky night," no "finally." Commentary contaminates the record. You want a clean table you can sort and count later.
A simple spreadsheet works. Columns A through D, one row per draw, going back as far as PCSO publishes on its results archive. For most games, that is years of data — thousands of rows per game. That is not a small sample. That is a proper dataset.
Why the Jackpot Column Matters More Than You Think
Most players ignore the jackpot figure except to daydream. Treat it as a signal. Track the jackpot trajectory across a rolling 30-draw window, and you will see the pot climb in a fairly predictable stair pattern until a major hit resets it. That rhythm tells you whether a game is in a "cold" cycle (long climb, no winners) or a "hot" cycle (frequent splits, pot stays moderate).
If you are playing for expected value rather than entertainment, the cold cycle is when the jackpot-to-odds ratio is most favorable. It never becomes favorable in an absolute sense — no lottery does — but the ratio moves, and you can see it move in your own log.
Step 2: Build a Frequency Table and Actually Read It
Now you analyze. For a 6/49 game, you have 49 possible numbers and thousands of draws. Count how many times each number appeared.
Here is what you will find, and it matters: the counts will not be perfectly equal. They never are. Across a few thousand draws, some numbers will sit 10 to 20 percent above the average hit rate, and others 10 to 20 percent below. That is normal variance, not a machine bias.
The Trap of the Hot Number
The instinct is to chase the hottest numbers. Resist the pure version of that instinct. A number that appeared 8 percent more often than average over 3,000 draws is statistically unremarkable — a random sequence produces exactly that kind of unevenness. What frequency data is actually good for is avoiding the extremes: don't build a ticket entirely from the top six hot numbers, and don't build one entirely from the six coldest.
Statisticians use frequency for banding, not for selection. Pick a band — say, numbers in the 40th to 70th percentile of hit frequency — and draw your picks from there. It feels less exciting. It is more honest.
Step 3: Track Gaps, the Metric Almost Nobody Uses
A "gap" is the number of draws between appearances of a specific number. If number 17 came out on Monday and again on Friday, the gap was 4 (or 3 intervening draws, depending on how you count — pick a convention and stay consistent).
For every number in your log, calculate the average gap. For a 6/49 game, the theoretical average gap is about 8.2 draws, because each number has a 6-in-49 chance per draw. Your observed averages will cluster near that number.
The useful part is the current gap — how many draws has this number been missing. If number 17 has been absent for 30 draws against an average gap of 8, it is running long. That does not mean it is "due." Balls do not remember. But it does mean the number is in an unusual stretch, and if you enjoy constructing tickets around streaks, this is the data you use.
Gap analysis does not predict. It describes. The value is in knowing whether your pick is in a normal stretch or an unusual one, so you can size your stake accordingly.
Applying Gaps to Stake Sizing
Serious players treat a normal-gap ticket as a standard bet and an extreme-gap ticket as a small speculative add-on. If your bankroll for the month is ₱2,000 across all games, something like ₱1,500 on structured picks and ₱500 on long-gap experiments is a defensible split. The stake discipline matters more than the picks.
Step 4: Analyze the Shape — Odd/Even, Low/High, and Sum Range
Individual numbers are only half the story. The composition of each winning combination follows patterns you can count.
- Odd/even split: In a 6-number combination from 49 balls, the most common splits are 3-odd/3-even, 4-odd/2-even, and 2-odd/4-even. A 6-0 or 0-6 split is rare — observed in roughly 1 to 2 percent of draws across long archives.
- Low/high split: Divide the pool at the midpoint. For 6/49, split at 25. Balanced 3-3 and 4-2 splits dominate.
- Sum range: The average sum of six numbers from 1 to 49 is 150. Most winning sums land between 115 and 185. Extremely low sums (under 80) and extremely high sums (over 220) are rare, though not impossible.
Why This Matters for Ticket Building
If you construct tickets that respect these shapes, you are not improving your odds of matching the draw — the draw does not care what shape you chose. What you are doing is avoiding the crowded shapes. Millions of players pick 1-2-3-4-5-6 or clusters around birthdays and anniversaries. Those combinations, if they ever hit, split the jackpot across dozens of tickets.
Statistically, the ideal jackpot ticket is one that is likely to appear and unlikely to be picked by others. Those two conditions are not identical. Shape analysis helps with the second one.
Step 5: Measure Repeat Behavior Between Consecutive Draws
Here is a question every draw archive can answer: how often does a number repeat from one draw to the next?
For a 6/49 game, the theoretical probability that any specific number appears in two consecutive draws is (6/49)², which is about 1.5 percent. Across six numbers, the expected number of repeats between consecutive draws is roughly 0.73. In practice, in any given back-to-back pair, you will see zero, one, or occasionally two repeats — and the long-run average will sit near that 0.73 figure.
What You Do With This
You use it to sanity-check your instinct. If you feel like "the same numbers keep coming back," your log will show you that repeats happen about as often as randomness predicts. If you feel like "nothing ever repeats," your log will correct that too.
Some players deliberately include one number from the previous draw in their ticket. Others deliberately exclude all repeats. Both approaches are defensible from a data standpoint because the effect size is small. What is not defensible is believing either approach gives you a meaningful edge. It does not. It only changes which parts of the number space you occupy — and that matters mostly for jackpot-sharing, as we covered in Step 4.
Step 6: Read the Payout Structure, Not Just the Top Prize
Most players read the jackpot and stop. The payout table below the jackpot is where the actual information sits.
Every PCSO game pays out at multiple tiers. For a 6/49 game, you get prizes for matching 6, 5, 4, and 3 numbers. The lower tiers are fixed (or fixed within a band), while the top tiers are parimutuel — split among all winners at that tier.
What to Track in the Payout Table
- Number of 5-match winners and the prize each got. A 5-match prize in a 6/49 game typically runs into the tens or hundreds of thousands of pesos, varying by the draw's total sales and winner count.
- The 4-match and 3-match fixed prizes. These are your realistic hit targets. If you are playing for entertainment, these are the tiers where you might actually land.
- Total winners at each tier versus total tickets sold. This gives you an observed hit rate you can compare to the theoretical rate.
Assuming typical sales figures for a mid-week draw, a 3-match winner pool might include a few thousand tickets and pay out in the low hundreds of pesos each. A 4-match winner pool might include a few dozen tickets and pay out in the low thousands. Track these numbers and you will develop an accurate feel for what a "win" actually pays.
Why the Lower Tiers Deserve Your Attention
If you play consistently, your realistic lifetime experience will be dominated by 3-match and occasional 4-match hits. Understanding their payout behavior gives you a clearer picture of the game's true return-to-player rate, which for PCSO games typically sits in the 45 to 55 percent range depending on the game and draw size. That is not a secret. It is in the numbers, and your payout log will show it.
Step 7: Set Expectations With the Odds Table
The final step is the one most players skip because it is uncomfortable. Know the odds cold, per game, per tier.
- Lotto 6/42: jackpot odds are 1 in 5,245,786.
- Mega Lotto 6/45: 1 in 8,145,060.
- Super Lotto 6/49: 1 in 13,983,816.
- Grand Lotto 6/55: 1 in 28,989,675.
- Ultra Lotto 6/58: 1 in 40,475,358.
These are fixed. No frequency chart, no gap analysis, no shape strategy changes them. What the seven steps above change is how you organize your play and how you interpret the results you see.
The Honest Frame
A statistician reads lotto results the way a weather analyst reads rainfall data — as a record of what happened, used to describe patterns and set expectations. Neither predicts the next event with certainty. Both produce better-informed decisions than guessing.
Apply the method. Keep the log. Set the stake before the draw, not after. And remember the baseline: PCSO games are entertainment products with a built-in house edge. The value you get from them is the value you choose to see — the analysis, the ritual, the small hope on a Wednesday night. Everything above is how to make that hope structured instead of scattered.
A Practical Weekly Routine You Can Start Tonight
Here is how the seven steps look as an actual routine, not a theory.
- After each draw (5 minutes): Log the six numbers, jackpot, winner counts, and payout tiers into your spreadsheet.
- Midweek (10 minutes): Update the frequency table and gap columns. It is one formula per row; a spreadsheet recalculates automatically once set up.
- Before you buy (10 minutes): Check the shape of your intended picks — odd/even, low/high, sum range. Adjust if you have accidentally built a birthday cluster (all numbers under 31) or a sequential run.
- Monthly (20 minutes): Review your payout log against the theoretical odds. Note where you stand. Adjust your stake up or down based on your own discipline rules, not based on wins or losses.
Total time investment: under an hour a week. What you get in return is a clear, honest picture of a game most people only guess at. That is the whole point of reading results like a statistician — not to beat the draw, but to stop being surprised by it.